


1.Measures of Dispersion types and formula.
(i) Range
Dispersion is also known as scatter, spread and variation.

|
Sr.No |
Sneh |
Amit |
Minna |
|
1 |
15000 |
7000 |
5000 |
|
2 |
15000 |
10000 |
2000 |
|
3 |
15000 |
14000 |
8000 |
|
4 |
15000 |
17000 |
10000 |
|
5 |
----- |
20000 |
50000 |
|
6 |
----- |
22000 |
----- |
|
Total income |
60000 |
90000 |
75000 |
|
Average income |
15000 |
15000 |
15000 |
Arithmetic Mean
- Types of measure of Dispersion

Solution:
Range =L-S
=20-7
=13
Coeff. of Range =L-S/L+S*100
=20-7/20+7*100
- Discrete series
| x | f |
| 5 | 3 |
| 10 | 7 |
| 15 | 5 |
| 20 | 12 |
| 25 | 9 |
Calculate range and coeff. of range?
Solution:
25-5
=20
Coeff. of Range
L-S/L+S*100
=25-5/25+5*100
=66.67%
- Continuous Series
| class | f |
| 20-25 | 2 |
| 25-30 | 5 |
| 30-35 | 9 |
| 35-40 | 4 |
| 40-45 | 7 |
Range= L-S
45-20
=25
Coeff. of range=L-S/L+S*100
=45-20/45+20*100
=38.46%
-Exclusive
| class | f |
| 20-24 | 2 |
| 25-29 | 5 |
| 30-34 | 9 |
| 35-39 | 4 |
| 40-44 | 7 |
| class | f |
| 19.5-24.5 | 2 |
| 24.5-29.5 | 5 |
| 29.5-34.5 | 9 |
| 34.5-39.5 | 4 |
| 39.5-44.5 | 7 |
Calculate range and Coeff. of Range.?
=44.5-19.5
=25
Coeff. of Range
=L-S/L+S*100
=44.5-19.5/44.5+19.5*100
=39.06%
2. Quartile Deviation
In such a situation, if the entire data is divided into four equal parts, each containing 25% of the values, we get the values of quartiles and median. The upper and lower quartiles (Q3 and Q1 , respectively) are used to calculate inter-quartile range which is Q3 – Q1 .

Inter quartile range is based upon middle 50% of the values in a distribution and is, therefore, not affected by extreme values. Half of the inter-quartile range is called quartile deviation (Q.D.).

Calculate range and Q.D. of the following observations: 20, 25, 30, 41, 29, 35, 39, 48, 51, 60 and 70
Sol.- Firstly arrange value in ascending or descending order.
For Q.D., we need to calculate values of Q3 and Q1
Q1 is the size of n +1 th/4th value.
(11+1)/4=3
n being 11, Q1 is the size of 3rd value. As the values are already arranged in ascending order, it can be seen that Q1 , the 3rd value is 29.
Similarly,
Q3 is size of 3( n +1)/4)value;
3(11+1)/4
36/4=9
i.e. 9th value which is 51. Hence Q3 = 51 =
Q.D=Q3-Q1/2
=(51-29)/2
| Month | Income |
| Jan | 139 |
| Feb | 140 |
| Mar | 140 |
| Apr | 141 |
| May | 141 |
| Jun | 142 |
| July | 142 |
| Aug | 143 |
| Sep | 143 |
| Oct | 144 |
| Nov | 144 |
| Dec | 145 |
| x | f |
| 5 | 2 |
| 2 | 2 |
| 9 | 1 |
| 10 | 5 |
| 15 | 3 |
| x | f | c.f |
| 2 | 1 | 1 |
| 5 | 2 | 3 |
| 9 | 2 | 5 |
| 10 | 5 | 10 |
| 15 | 3 | 13 |
Q3=3(n+1)/4
=3(13/4)
=10.5 th term
10th term+0.5(11th -10th)
=10+.5(5)
=12.5
Q.D= (Q3-Q1)/2
=5.5/2
=2.75
Coeff of Q.D= (Q3-Q1/Q3+Q1)*100
=(12.5-7/12.5+7.5)100
=28.2%
3)Continuous series

| Class interval C I | No of student (f) |
| 0-10 | 5 |
| 10--20 | 8 |
| 20-40 | 16 |
| 40-60 | 7 |
| 60-90 | 4 |
| 40 |
| Class interval C I | No of student (f) | CF |
| 0-10 | 5 | 5 |
| 10--20 | 8 | 13 |
| 20-40 | 16 | 29 |
| 40-60 | 7 | 36 |
| 60-90 | 4 | 40 |
| 40 |
Q1 is the size of n th/ 4 value in a continuous series.
Thus, N=40 , 40/4=10, it is the size of the 10th value.
The class containing the 10th value is 10–20. Hence, Q1 lies in class 10–20. Now, to calculate the exact value of Q1 , the following formula is used:
Where L = 10 (lower limit of the relevant Quartile class)
and f = 8 (frequency of the quartile class)
Q1= 10+(10-5)/8*10=16.25
Similarly, Q3 is the size of 3n/4 th value
value; i.e., 30th value, which lies in class 40–60. Now using the formula for Q3 , its value can be calculated as follows:
Q3=40+(30-29)/7*20=42.87
QD=Q3-Q1/2
(42.87-16.25)/2=13.31
Standard Deviation

The standard deviation is the average amount of variability in your dataset. It tells you, on average, how far each value lies from the mean.
A high standard deviation means that values are generally far from the mean, while a low standard deviation indicates that values are clustered close to the mean.
Standard deviation is a useful measure of spread for normal distributions.
In normal distributions, data is symmetrically distributed with no skew. Most values cluster around a central region, with values tapering off as they go further away from the center. The standard deviation tells you how spread out from the center of the distribution your data is on average.
Many scientific variables follow normal distributions, including height, standardized test scores, or job satisfaction ratings. When you have the standard deviations of different samples, you can compare their distributions using statistical tests to make inferences about the larger populations they came from.
Standard deviation formulas
| Formula | Explanation |
|---|---|
 |
|

c) Coeff. of S.D= σ / x̅
we have given data set below:
| Data Set(score) | |||||
| 46 | 69 | 32 | 60 | 52 | 41 |
1.Find the mean.
x̅ = (46 + 69 + 32 + 60 + 52 + 41) ÷ 6 = 50
2.Find each score’s deviation from the mean.
| Score | Deviation from the mean |
| 46 | 46 – 50 = -4 |
| 69 | 69 – 50 = 19 |
| 32 | 32 – 50 = -18 |
| 60 | 60 – 50 = 10 |
| 52 | 52 – 50 = 2 |
| 41 | 41 – 50 = -9 |
3. Square each deviation from the mean and find the sum of square.
| Score | Deviation from the mean | (X-x̅)2 |
| 46 | 46 – 50 = -4 | 16 |
| 69 | 69 – 50 = 19 | 361 |
| 32 | 32 – 50 = -18 | 324 |
| 60 | 60 – 50 = 10 | 100 |
| 52 | 52 – 50 = 2 | 4 |
| 41 | 41 – 50 = -9 | 81 |
| 886 |
4.Put the values in the formula
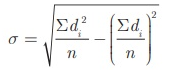
√ Σ(X-x̅)2/n
Coeff. of S.D= σ/ x̅
=.2428
Variances= (σ)2=147.6
Calculate Standard Deviation by Assumed Mean Method
10,12,13,15,20
Sol-
Firstly we will find the some of d and sum of square of d according to formula,
Here we assume d= 13(middle value) ,
| x | d=x-13 | d2 |
| 10 | -3 | 9 |
| 12 | -1 | 1 |
| 13 | 0 | 0 |
| 15 | 4 | 16 |
| 20 | 7 | 49 |
| total | Σd=5 | Σd2=63 |
Now we will put the values in formula
=√ 63/5-(5/5)2
=√12.6-1
=√11.6
=3.4
Coeff. of S.D= σ/ x̅
=3.4/14
=.2428
Variance=(σ)2
11.6
Coeff. of Variance= (σ/ x̅)*100
=.2428*100
=24.28
2.Continuous Series
σ= (√ Σfd2/N(Σfd/N)2 ) x h
∑ fd
i(xifd
x¯)2N
| Class | f |
| 0-10 | 15 |
| 10-20 | 15 |
| 20-30 | 23 |
| 30-40 | 22 |
| 40-50 | 25 |
| 50-60 | 10 |
| 60-70 | 5 |
| 70-80 | 10 |
Sol-
| Class | f | Mid Value | d | d2 | fd | fd2 |
| 0-10 | 15 | 5 | -3 | 9 | -45 | 135 |
| Oct-20 | 15 | 15 | -2 | 4 | -30 | 60 |
| 20-30 | 23 | 25 | -1 | 1 | -23 | 23 |
| 30-40 | 22 | 35 | 0 | 0 | 0 | 0 |
| 40-50 | 25 | 45 | 1 | 1 | 25 | 25 |
| 50-60 | 10 | 55 | 2 | 4 | 20 | 40 |
| 60-70 | 5 | 65 | 3 | 9 | 15 | 45 |
| 70-80 | 10 | 75 | 4 | 16 | 40 | 160 |
| N=125 | 2 | 488 |
σ=(√ 488/125-(2/125)2 ) *10
Mean=A+(Σfd/Σf) x h
35+(2/125)*10
35+0.16
35.16
σ/ x̅
=19.16/35.16
=0.5620
Variance=(σ)2
=(19.76)2
=390.45
Coeff. of Varience= σ/ x̅*100
=56.2%
Mean Deviation
MEASURES OF DISPERSION FROM AVERAGE
Since the average is a central value, some deviations are positive and some are negative. If these are added as they are, the sum will not reveal anything. In fact, the sum of deviations from Arithmetic Mean is always zero. Look at the following two sets of values.
Suppose a college is proposed for students of five towns A, B, C, D and E which lie in that order along a road. Distances of towns in kilometers from town A and number of students in these towns are given below:
| Town | Distance from town | Students |
| a | 0 | 90 |
| b | 2 | 150 |
| c | 6 | 100 |
| d | 14 | 200 |
| e | 18 | 80 |
| 620 |
Now, if the college is situated in town A, 150 students from town B will have to travel 2 kilometers each (a total of 300 kilometers) to reach the college. The objective is to find a location so that the average distance travelled by students is minimum.
You may observe that the students will have to travel more, on an average, if the college is situated at town A or E. If on the other hand, it is somewhere in the middle, they are likely to travel less. Mean deviation is the appropriate statistical tool to estimate the average distance travelled by students. Mean deviation is the average. The average used is either the arithmetic mean or median .
Calculation of Mean Deviation from Arithmetic Mean for ungrouped data
Direct Method Steps:
(i) The A.M. of the values is calculated
(ii) Difference between each value and the A.M. is calculated. All differences are considered positive. These are denoted as |d|
(iii) The A.M. of these differences (called deviations) is the Mean Deviation

A.M=SUM of X/N
30/5=6
| X | I X-X bar=d I |
| 2 | 4 |
| 4 | 2 |
| 7 | 1 |
| 8 | 2 |
| 9 | 3 |
| 12 |
M.D(x) =12/5=2.4
Mean Deviation from median for ungrouped data.
Method Using the values in Example 3, M.D. from the Median can be calculated as follows
| X | Id I (X-median) |
| 2 | 5 |
| 4 | 3 |
| 7 | 0 |
| 8 | 1 |
| 9 | 2 |
| 11 |
Steps:
(i) Calculate the median which is 7.
(ii) Calculate the absolute deviations from median, denote them as |d|.
(iii) Find the average of these absolute deviations.
M.D (median)=11/5=2.21
Mean Deviation from Mean for Continuous Distribution
Example:
| Profits of Companies (Rs in lakh) Class intervals | Number of companies |
| 10-20 | 5 |
| 20-30 | 8 |
| 30-50 | 16 |
| 50-70 | 8 |
| 70-80 | 3 |
| 40 |
Steps:
(i) Calculate the mean of the distribution.
(ii) Calculate the absolute deviations |d| of the class midpoints from the mean.
(iii) Multiply each |d| value with its corresponding frequency to get f|d| values. Sum them up to get Σ f|d|.
(iv) Apply the following formula,
M.D( x ) = Σ f | d | / Σ f
| Profits of Companies (Rs in lakh) Class intervals | Number of companies(F) | Mid-point | I d I | fI d I |
| 10-20 | 5 | 15 | 25 | 125 |
| 20-30 | 8 | 25 | 15 | 120 |
| 30-50 | 16 | 40 | 0 | 0 |
| 50-70 | 8 | 60 | 20 | 152 |
| 70-80 | 3 | 75 | 35 | 102 |
| 40 | 499 |
M.D( x ) = Σ f | d | / Σ f
=499/40
=12.47
Means deviation : comment
Mean deviation is based on all values. A change in even one value will affect it. Mean deviation is the least when calculated from the median i.e., it will be higher if calculated from the mean. However it ignores the signs of deviations and cannot be calculated for open ended distributions.
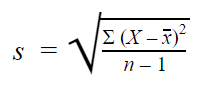
As you can see in above example ,Mean is same but dispersion is very at every point .If you have another value which reflects the quantum of variation in values, your understanding of a distribution improves considerably. For example, per capita income gives only the average income. A measure of dispersion can tell you about income inequalities, thereby improving the understanding of the relative standards of living enjoyed by different strata of society.
Thank you
For free study materials and for more information,
Please visit our website-Study.taxwill.in
For one to one tutor :call on +918700745227
Mail us on taxwill4u@gmail.com
- Business studies
- Economics
- Accounts